What is that worth
in AI images?
Environmental figures are hard to picture. Compare familiar activities with the estimated energy use or carbon footprint of generating AI images.
Estimated energy
400 Wh
AI-generated images
Typical estimate uses 2.9 Wh per image. Because a more energy-intensive image has a larger impact, fewer images fit into the same equivalent.
It started with a slightly cheeky question.
Discussions about AI image generation often include figures for electricity use or carbon emissions, but isolated numbers are difficult to interpret. Is 3 Wh significant? What does 500 g CO₂e feel like in everyday terms?
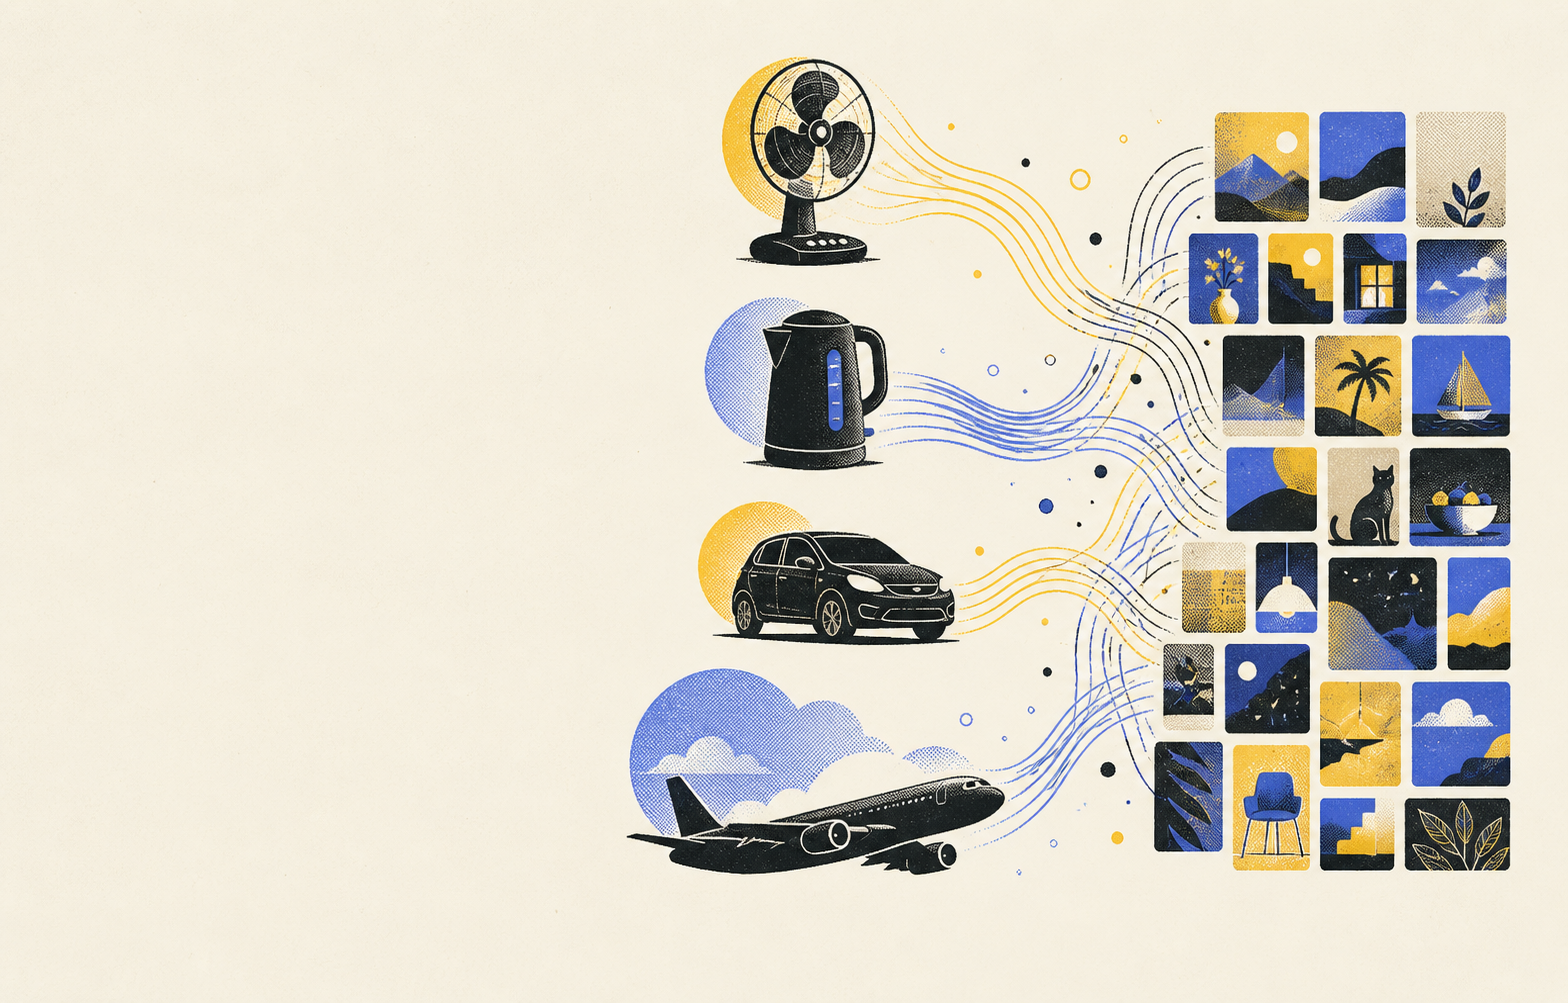
AI Image Equivalent puts those estimates beside familiar activities: running a fan, boiling a kettle, driving a car or taking a flight.
The purpose isn’t to excuse AI’s environmental impact or exaggerate it. It’s to replace abstract numbers with understandable context, using transparent assumptions and published evidence.
ONE NUMBER ISN’T THE WHOLE STORY
Same image.
Different impact.
Model choice, hardware, resolution, inference steps, batching, data-centre efficiency and the local electricity mix can all change the result. That’s why every answer includes a range.
Transparent by design.
These are estimates for relative scale, not measurements of any individual image, product or journey.
01 AI image generation+
There is no universal energy cost. The central 2.9 Wh estimate follows the mean measured by Luccioni, Jernite & Strubell across image-generation models. We use 0.7 to 11.5 Wh to expose variation. Hardware, resolution, steps, batching and data-centre overhead can change real use.
02 Electricity and carbon+
Watts describe power. Watt-hours describe energy over time. Carbon is calculated separately using 143.95 gCO₂e/kWh for consumed UK electricity. Electricity and carbon are never treated as interchangeable.
03 Flights and transport+
Flights use published passenger-kilometre factors, cabin allocation and optional non-CO₂ effects. Simple mode estimates distance at 800 km per flight-hour. Cars and public transport use 2026 UK factors.
04 Food and drink+
Food results are lifecycle screening estimates that can include agriculture, processing, transport and preparation. Recipes, farms and serving sizes vary greatly. Black coffee uses the midpoint of a published 38 to 98 gCO₂e range per 140 ml cup; other meal and drink presets use representative UCL factors.
05 Hotels and homeworking+
Hotel factors apply per occupied room-night, not per guest. Homeworking uses the official per-FTE-hour screening factor for incremental office equipment and heating. Neither estimate represents the full footprint of a holiday, employer or person.
06 Waste and shopping+
Landfill factors include collection, transport and decomposition. Recycling, composting and anaerobic-digestion factors cover transport to the first treatment point only, so routes must not be compared as if their boundaries were identical. Delivery estimates allocate a vehicle journey across entered stops and exclude warehousing, packaging and product manufacture.
07 Leisure, gardening and DIY+
Powered activities use watts multiplied by duration. Preset wattages are editable illustrations because equipment ratings, operating cycles, insulation and weather can materially change real consumption.
Measured 1,000 sequential inferences across popular image-generation models. The study reports a 2.907 kWh mean, a 1.35 kWh median and an 11.49 kWh upper observed model result per 1,000 images.
Open source ↗2026UK Government GHG Conversion Factors 2026July 2026 revised flat file. Used for UK electricity, fuels, vehicles, public transport and aviation.
Open source ↗2024DfT journey emissions methodologyExplains distance uplift, passenger allocation, cabin class and the optional 1.9 radiative-forcing multiplier.
Open source ↗2022UCL Food and Catering Emissions ReportLifecycle screening factors for representative meals and drinks. Food production varies considerably, so these are broad contextual estimates.
Open source ↗2020Carbon and water footprint of coffee consumed in FinlandPeer-reviewed cradle-to-grave assessment of black coffee, including cultivation, processing, brewing and end of life.
Open source ↗2025WRAP CarbonWARM2UK waste-management factors. Boundaries differ by route, so results are indicative and not a complete recycling-versus-landfill assessment.
Open source ↗